Beginning Fuzz Cycle Automation: Improving Testing And Fuzz Development With Coverage Analysis
In my previous post, we covered using bncov to do open-ended coverage analysis tasks to inform our testing. This time we’ll take a look at how to write better tests in the form of harness programs (also known as fuzz drivers, programs written to exercise specific parts of the code) that we will use for fuzz testing.
The basic idea in both unit testing and fuzzing is that we want to thoroughly test our code to increase our confidence and get reassurance that it performs as expected in the face of unexpected inputs or scenarios. If we want to improve our confidence, we can add steps to exercise more of the code. With unit testing, this means writing more unit tests; with fuzzing, this means running the fuzzer longer, making a better starting corpus, or writing more harness programs. By leveraging coverage analysis, we can automate presentation of results from fuzzing to assist us in a roughly iterative approach and get more out of our fuzzing:
- Write a good fuzz harness (or find an existing one)
- Maximize coverage of each harness with coverage analysis
- Increase knowledge of the target and what code is left to cover
- Repeat
For now we’ll focus on the last of those items: how to write more/better harness programs and understand how to improve coverage. For the rest of the article we will focus on block coverage because standard line or statement coverage metrics directly correspond to block coverage in compiled code (for more information on the basics of code coverage, check out https://en.wikipedia.org/wiki/Code_coverage).
Want to Learn More About Zero-Days?
Catch the FASTR series to see a technical proof of concept on our latest zero-day findings. Episode 2 features uncovering memory defects in cereal.
Watch EP 02 See TV Guide
Return to TinyXML2
Following on the last post, we will look at TinyXML2, an open source C++ XML library with an existing fuzz harness for integration with Google’s OSS-Fuzz project. We’d like to improve on our coverage that we found in the first post, so we’ll go through the process I outlined above. Let’s start by taking a look at the existing fuzz harness, which is really just one function in the LibFuzzer format, called LLVMFuzzerTestOneInput. This function specifies that arbitrary fuzz data will be given to the function via the data argument with length specified via size:
If you’re familiar with unit testing, you can see how this looks a lot like a unit test, except the input is a variable. To understand what code is exercised by this harness, there are several traditional tools that we’ll cover quickly before moving on to the possibilities with a flexible tool like bncov. The most common way for a developer to understand what code a test exercises is to look at line coverage using special builds instrumented with coverage via gcov/SanitizerCoverage and then running post-processing to view line coverage with a tool like lcov, llvm-cov, or even inside an existing IDE.
Using graphical tools is nice because it allows you to casually browse the source and poke around for uncovered section, and while such tools should be in every developer’s toolkit, they aren’t as well suited for building custom analysis. bncov can ingest coverage data in the drcov format, which allows us to record block coverage via Dynamic Binary Instrumentation (DBI) rather than compiling a special binary with instrumentation, as you would with gcov. All of these tools do essentially the same thing: record block or edge coverage as code executes, then interpret and render that data. DynamoRIO even provides drcov2lcov, a utility that allows a developer to produce lcov HTML reports using drcov files (http://dynamorio.org/docs/page_drcov.html).
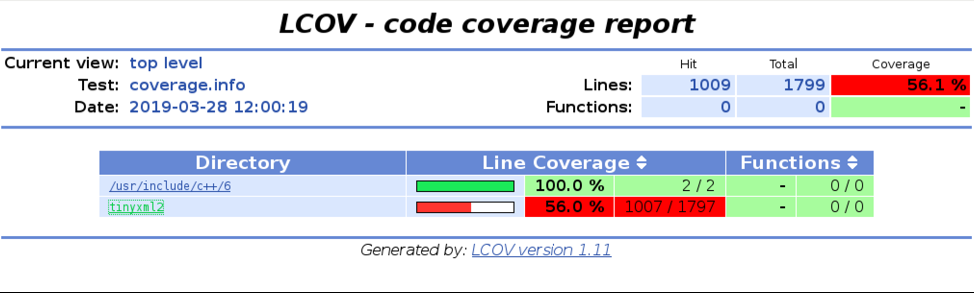
Using drcov2lcov to Produce LCOV Reports
The first pass is to fuzz using the existing oss-fuzz harness, and then produce line coverage reports to see where we are missing coverage. This idea is the same with unit tests, and gives insights into potential untested options or functions. What we’re looking for in this case is places where we can add functionality in order to increase the amount of code covered, which usually means adding calls to other functions or changing options to more permissive or inclusive settings. The goal in improving the first harness is to strictly add functionality, not duplicate or remove any, and if we were doing things the old-fashioned way, we’d have to dig into the source code or documentation to find potential candidates.
Enter the Ninja
As soon as you have inputs generated from fuzzing, you can start to analyze coverage with bncov and get feedback automatically. Using the methods previously discussed to gather block coverage information, you can either visualize the information via block coloring in Binary Ninja or produce reports with the Python API as with the script summarize_coverage.py in the repo (if you have a Personal/Student license for Binary Ninja you can still use script and use bncov with the built-in python console or the snippets editor).
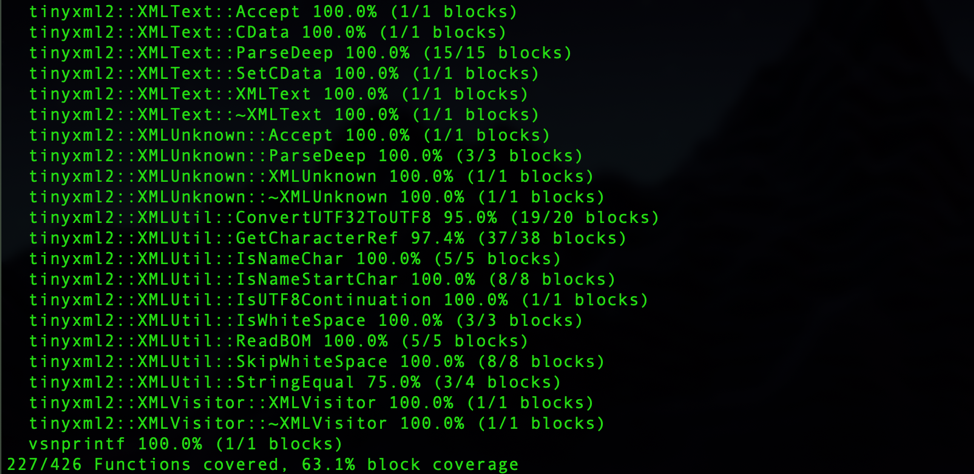
Basic Coverage Summary Using bncov
Getting information like this automatically is cool, but it’s just presenting mostly unprioritized data for us to explore, just like lcov. Instead, what we’d rather do is understand the questions we’re usually asking when we read line coverage reports, and then write scripts that answer those questions. Then we can use the scripts to automatically present us the answers every time we stop fuzzing. An example initial question is “what functionality didn’t get covered?” which you could approach from several angles, but we’ll use the idea of what we call the “coverage frontier,” which shows places where a conditional was reached but there was a conditional statement (such an if or else) that was never taken across all inputs. The coverage frontier can be quite large, so it may be too much information depending on the size of the code under test, but if you want to look at it there is a bncov feature to take you on a visual tour (the following commands would be entered in Binary Ninja’s Python Console).
# First import coverage: Right-click -> bncov -> "Coverage Data" -> "Import Directory"
import bncov
covdb = bncov.covdb
bncov.tour_set(bncov.covdb.get_frontier(), 5)

5-Second Tour of the Frontier
While this is a good demonstration of automation, it’s not necessarily helping us reach any conclusions. Instead let’s ask a more focused question like: “what are all the branches we didn’t take that would’ve led to a function call?” One way to script this question would be to look in functions for which we have some coverage, and look for calls to other functions by examining each assembly instruction in basic blocks that weren’t covered, as is shown below. If there were a large number of results, we could further extend this to only look at basic blocks that are only one or two steps removed from the coverage frontier, but for this example we don’t need it.
covdb = bncov.covdb
stats = covdb.collect_function_coverage()
for func in bv.functions: # BinaryView object containing analysis information
if stats[func.name].blocks_covered == 0:
continue
for block in func:
if block.start in covdb.total_coverage:
continue # only look at uncovered blocks
block_offset = 0
for instruction in block:
token_list, inst_size = instruction
inst_addr = block.start + block_offset
if func.is_call_instruction(inst_addr):
print("0x%x: %s" % (inst_addr, bv.get_disassembly(inst_addr)))
block_offset += inst_size
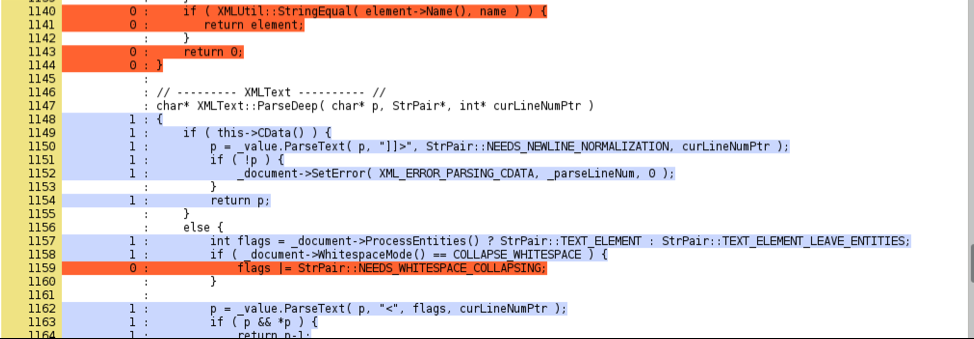
Now we can find function calls that we missed, but we can make this one step better still: by automating calls to the binutils addr2line utility we can take these addresses and look up the source code line that the addresses correspond to as long as we compiled with the -g flag. The result: source code snippets for all untaken branches leading to function calls served up to us on a silver platter (you can check out the final version of find_uncovered_calls.py in the repo for more). For a very small target like TinyXML2 and the coverage I had after fuzzing the first harness, this yielded five source locations, one of which contained a hint to an optional parameter that could expand coverage as shown below. Now we’ve made a step towards reducing manual effort and automating the process of condensing test results into something we can quickly understand.
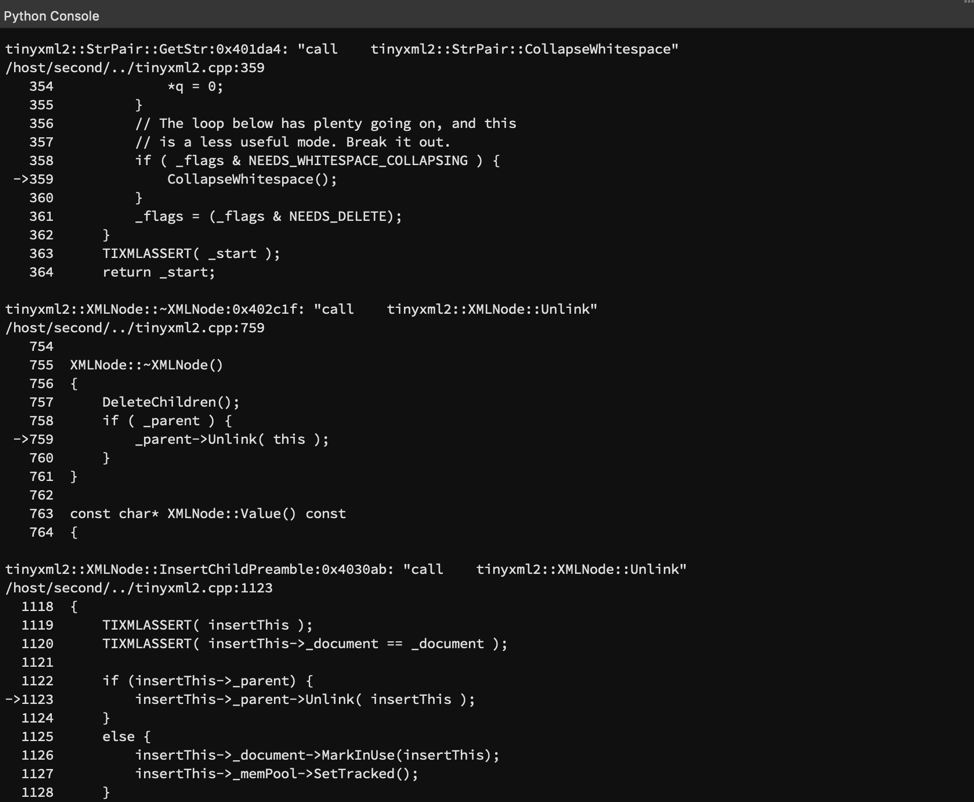
Finding uncovered function calls with bncov scripts
So to bring this back to our original goal of finding additional functionality to add to the fuzzing harness, we should investigate why these function calls didn’t happen during our fuzzing run, and then decide if there’s any changes we can make to our harness to make it cover more code paths. In this case, looking at this uncovered call to CollapseWhitespace() leads to the understanding that we can cover more code under XMLDocument::Parse() by adding the COLLAPSE_WHITESPACE argument to the constructor of our XMLDocument object.
Taking A Look Around
One more step we want to do in order to exercise more code would be to look at other functions related to what we’re already doing in the fuzzing harness. This typically means looking for other top-level functions exposed in the API, using other member variables/functions of the structs and classes in use, or adding optional steps in the workflow that our current fuzz harness is performing. Some pitfalls we need to steer clear of are: duplication of effort which will just slow down the fuzzer, calling functionality that is incorrect for the target in the current situation, and choices that limit the code covered (we want a strict superset, otherwise we’d have to make tradeoffs which we will look at later). Normally this requires diving into the docs and reading until we come up with options.
Since we have coverage data, we can use bncov to help us identify candidate functions for adding to our fuzzing harness. We can just list out all functions that currently have zero coverage, but that will return a lot of results (243 in my example). What if we just limited the results to zero-coverage functions in XMLDocument, the primary class used in our harness? Using the snippet below, this gives us 21 candidate functions which we can narrow down to a few functions that clearly exercise related functionality that are unreachable given our current target (for example: tinyxml2::XMLDocument::Print()).
Now we can filter the 21 results based on whether they are exposed and worth fuzzing, which is still going to be manual and up to your discretion. Most of the functions in this example can be quickly filtered by their name or by reading them due to their small size (you could also filter out functions based on len(func.basic_blocks)). So with a couple of candidates that exercise new functionality, we can go ahead and add them to our harness. With the improvements we’ve made, we can now build it, fuzz for a bit, and then revisit coverage analysis.
Comparing coverage across harnesses can be tricky, because the same source code can produce binaries that look pretty different depending on compilers and options. That being said, block coverage comparison will generally work if you’re compiling on the same system with the same options, otherwise you can use source line coverage which should also be a pretty safe option. What we’re looking to see: 1) that no functions (other than possibly our main LLVMFuzzerTestOneInput function) have a lower block coverage percentage in the second version, 2) no functions had significant changes in the number of blocks they contain, and 3) there’s a general upward trend toward overall coverage percentage, as shown in the coverage summaries below.
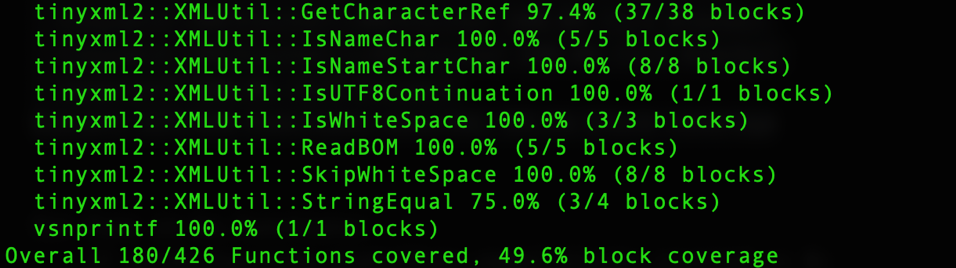
Comparing coverage summaries between harnesses
But Seriously, When Do We Stop Fuzzing?
There’s been some recent discussion on how to project when a fuzzer has found most of the coverage it’s going to find, but it all boils down to the general idea that coverage discovery follows a logarithmic progression and you get diminishing returns the longer you run it. There’s a lot of opinions on metrics to use but the most significant factor is how much CPU time you’re comfortable with spending on a target. Instead of debating the expected value of running a fuzzer for an extra day or two, I think it’s more effective to adopt the following mindset:
I stop on a specific fuzzer when coverage plateaus. But that just means it's time to write a better fuzzer for the target :)
— Brandon Falk (@gamozolabs) May 15, 2019
The real goal isn’t to make one fuzz harness, but to have multiple harnesses that target different sections of the code. This is as much about efficiency as it is about being realistic about being able to effectively cover the entire codebase with one harness. Up to now we’ve just focused on the initial “parse” harness, but haven’t focused on fuzzing any helper functions directly or trying to exercise the parts of the library that can also take variable input. We’ll save that topic for later, but for now we’ll leave it at the idea that the right approach is an iterative process for writing harnesses, where you’re both increasing the coverage of your fuzzing as well as your knowledge of what is left to target and what you might need to do to cover it.
You might be thinking you could have done all this without any automation just by reading documentation and reading source… in this situation, you’re probably right since the target codebase is so small. But I’m advocating for advances in tools and automating processes, which is why this article focused on using bncov to answer questions quickly and improve the testing cycle. To review, the process demonstrated in this article:
- Write a good fuzz harness (or find an existing one)
- Maximize coverage of each harness with coverage analysis
- Increase knowledge of the target and what code is left to cover
- Repeat
Hopefully this article has shown how to automate some of the common tasks in testing and fuzzing, and sparked some new ideas of your own on how to automate analysis.
Recent Blogs

Introducing Mayhem’s Dynamic SBOM Generation and SCA Validation Feature
.jpg)
Add Mayhem to Your DevSecOps for Free.
Get a full-featured 30 day free trial.